NOTES:
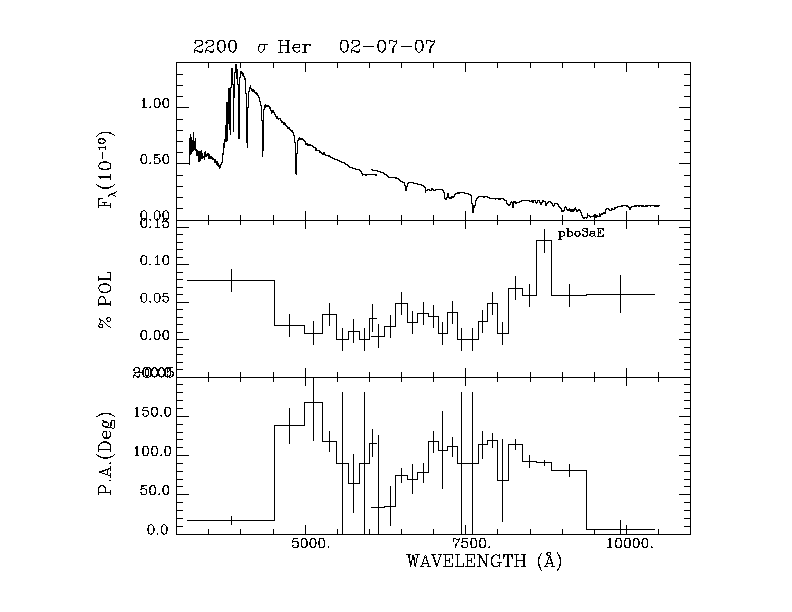
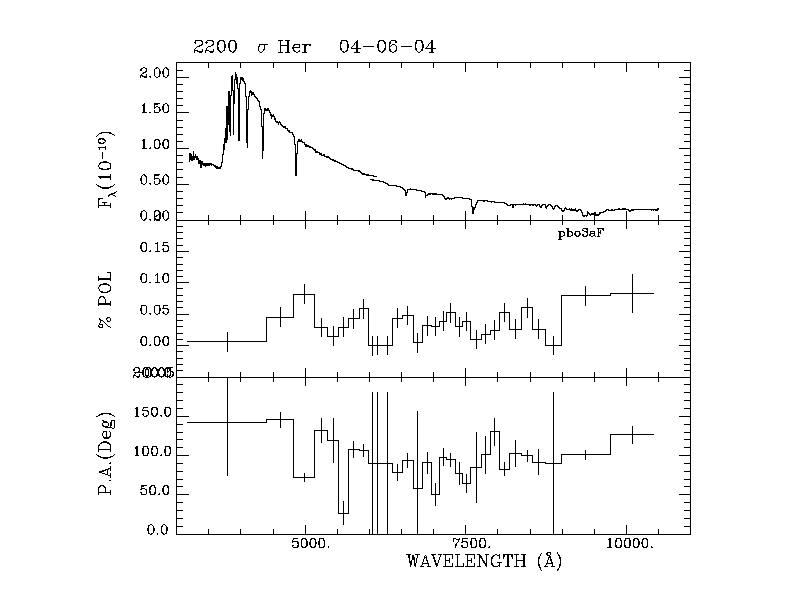
For data that has a TRIPLOT available, you can view that triplot by clicking on the date, or the TRIPLOT button in the far right column of the data.
Data listed in RED should be considered preliminary results only.
Filter data listed in
this color
represent bandpasses that include a falloff in instrument response.
(See the descriptions of Wav1 and Wav2
for grating cutoff versus filter bandpasses.)
| Target | Date | MJD | ExpT | Wav1 | Wav2 | %Q | %U | %Err | %Pol | PA | Pub | Cal | Comments | Triplot |
|---|---|---|---|---|---|---|---|---|---|---|---|---|---|---|
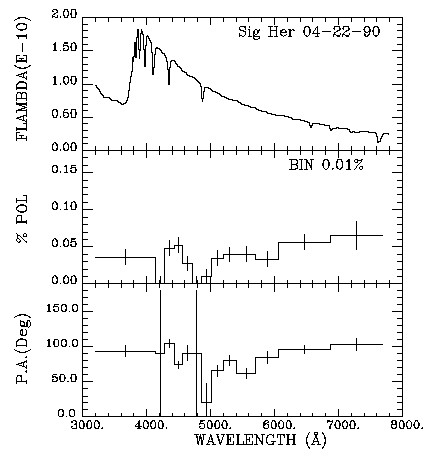
| Sig-Her | 19900422 | 48003.10 | 6144 | 3201.0 | 7683.0 | -0.0273 | 0.0062 | 0.0028 | 0.0280 | 83.580 | C2 | pbo2c3 | _ | Triplot |
| UX | UX | -0.0368 | -0.0048 | 0.0104 | 0.0372 | 93.704 | ||||||||
| B | B | -0.0279 | 0.0015 | 0.0021 | 0.0280 | 88.485 | ||||||||
| V | V | -0.0270 | 0.0175 | 0.0021 | 0.0322 | 73.512 | ||||||||
| R | R | -0.0427 | -0.0106 | 0.0031 | 0.0440 | 96.955 | ||||||||
| I | I | -0.0672 | -0.0084 | 0.0164 | 0.0677 | 93.569 | ||||||||
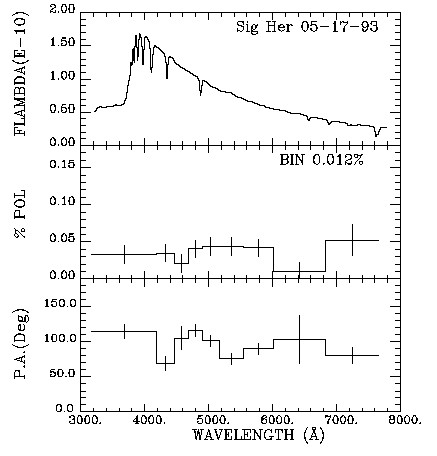
| Sig-Her | 19930517 | 49124.09 | 4915 | 3171.0 | 7665.0 | -0.0305 | -0.0055 | 0.0041 | 0.0309 | 95.090 | _ | pbo2d6 | _ | Triplot |
| UX | UX | -0.0247 | 0.0337 | 0.0104 | 0.0418 | 63.109 | ||||||||
| B | B | -0.0245 | -0.0130 | 0.0030 | 0.0277 | 103.959 | ||||||||
| V | V | -0.0433 | -0.0020 | 0.0033 | 0.0434 | 91.353 | ||||||||
| R | R | -0.0345 | 0.0000 | 0.0041 | 0.0345 | 90.005 | ||||||||
| I | I | -0.0221 | 0.0151 | 0.0170 | 0.0267 | 72.804 | ||||||||
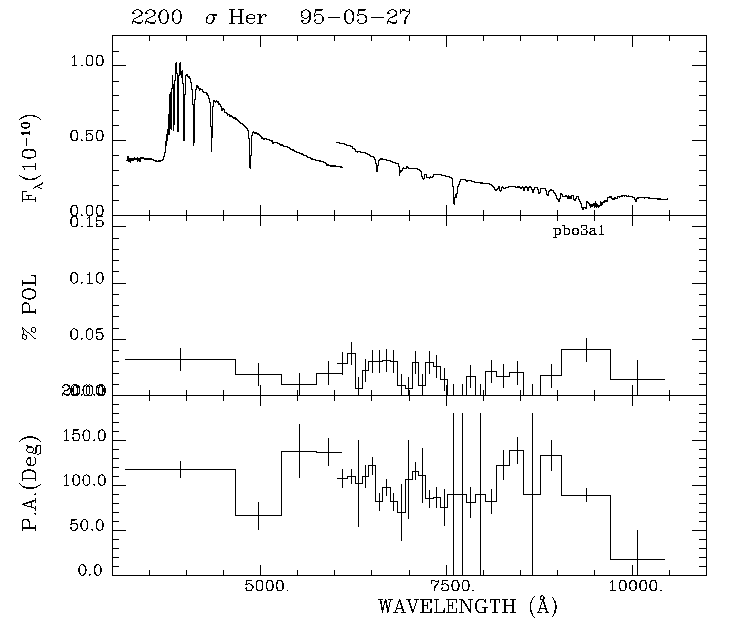
| Sig-Her | 19950527 | 49864.66 | 1024 | 3175. | 6091. | -0.0076 | -0.0124 | 0.0050 | 0.0145 | 119.18 | _ | pbo3a1 | Cldy | Triplot |
| Sig-Her | 19950527 | 49864.63 | 1536 | 6030. | 10434. | -0.0170 | -0.0061 | 0.0020 | 0.0180 | 99.84 | _ | pbo3a1 | Cldy | Triplot |
| UX | UX | 0.0092 | -0.0821 | 0.0182 | 0.0826 | 138.190 | ||||||||
| B | B | -0.0210 | -0.0138 | 0.0052 | 0.0251 | 106.692 | ||||||||
| V | V | -0.0082 | -0.0085 | 0.0036 | 0.0118 | 113.065 | ||||||||
| R | R | -0.0150 | -0.0130 | 0.0016 | 0.0198 | 110.431 | ||||||||
| I | I | -0.0116 | -0.0044 | 0.0015 | 0.0124 | 100.437 | ||||||||
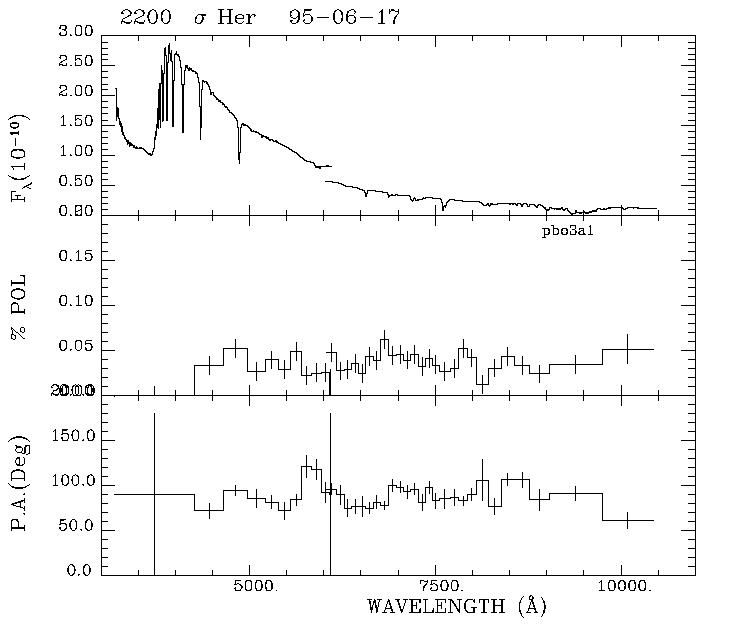
| Sig-Her | 19950617 | 49885.70 | 2048 | 3175. | 6097. | -0.0280 | 0.0019 | 0.0031 | 0.0281 | 88.01 | _ | pbo3a1 | _ | Triplot |
| Sig-Her | 19950617 | 49885.70 | 1536 | 6034. | 10434. | -0.0361 | 0.0027 | 0.0020 | 0.0362 | 87.85 | _ | pbo3a1 | _ | Triplot |
| UX | UX | -0.0901 | 0.0365 | 0.0164 | 0.0972 | 78.970 | ||||||||
| B | B | -0.0169 | 0.0122 | 0.0036 | 0.0208 | 72.067 | ||||||||
| V | V | -0.0318 | 0.0056 | 0.0023 | 0.0323 | 84.984 | ||||||||
| R | R | -0.0306 | -0.0023 | 0.0015 | 0.0306 | 92.177 | ||||||||
| I | I | -0.0331 | -0.0015 | 0.0014 | 0.0331 | 91.276 | ||||||||
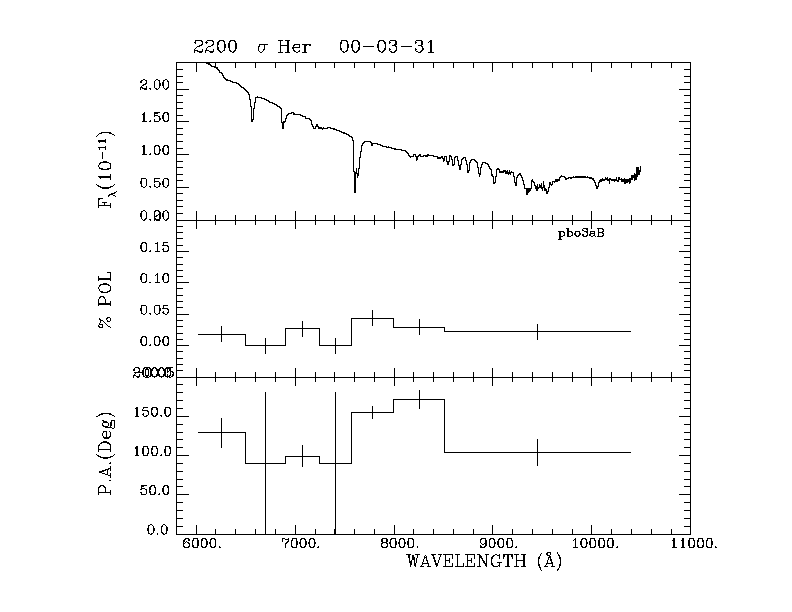
| Sig-Her | 20000331 | 51634.86 | 1536 | 6026. | 10394. | -0.0004 | -0.0109 | 0.0045 | 0.0109 | 133.98 | _ | pbo3aB | no cals;red only | Triplot |
| UX | UX | _ | _ | _ | _ | _ | ||||||||
| B | B | _ | _ | _ | _ | _ | ||||||||
| V | V | _ | _ | _ | _ | _ | ||||||||
| R | R | -0.0038 | -0.0112 | 0.0033 | 0.0119 | 125.754 | ||||||||
| I | I | 0.0181 | -0.0163 | 0.0032 | 0.0243 | 158.996 | ||||||||
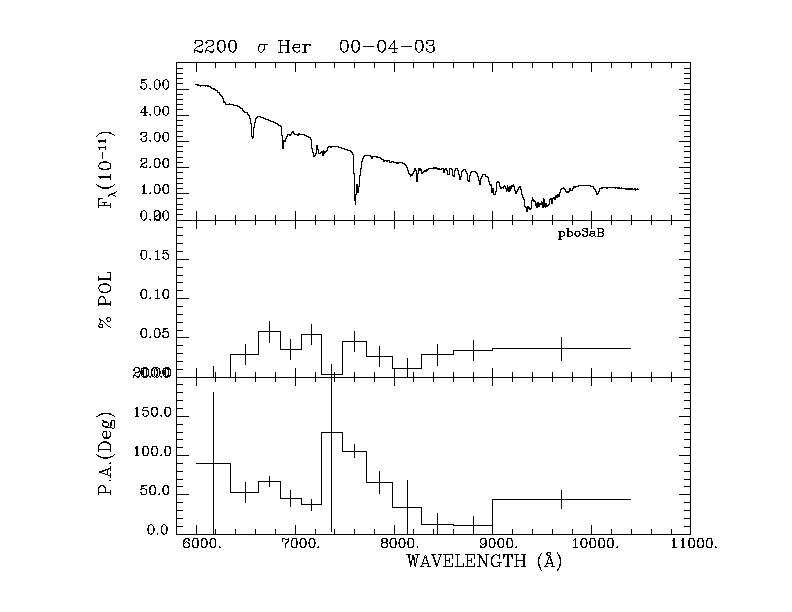
| Sig-Her | 20000403 | 51637.69 | 768 | 6002. | 10394. | -0.0016 | 0.0194 | 0.0038 | 0.0195 | 47.40 | _ | pbo3aB | red only | Triplot |
| UX | UX | _ | _ | _ | _ | _ | ||||||||
| B | B | _ | _ | _ | _ | _ | ||||||||
| V | V | _ | _ | _ | _ | _ | ||||||||
| R | R | -0.0042 | 0.0181 | 0.0030 | 0.0186 | 51.578 | ||||||||
| I | I | 0.0005 | 0.0074 | 0.0026 | 0.0074 | 43.087 | ||||||||
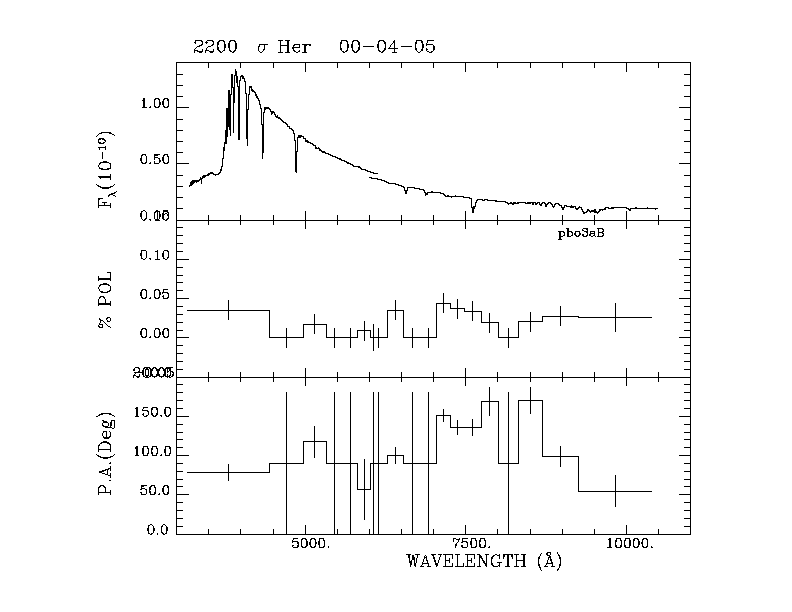
| Sig-Her | 20000405 | 51639.93 | 1280 | 3175. | 6112. | -0.0118 | 0.0017 | 0.0047 | 0.0120 | 85.87 | _ | pbo3aB | _ | Triplot |
| Sig-Her | 20000405 | 51639.91 | 768 | 6010. | 10394. | 0.0020 | -0.0108 | 0.0035 | 0.0110 | 140.11 | _ | pbo3aB | _ | Triplot |
| UX | UX | -0.0591 | 0.0468 | 0.0179 | 0.0753 | 70.818 | ||||||||
| B | B | -0.0183 | 0.0099 | 0.0052 | 0.0208 | 75.814 | ||||||||
| V | V | -0.0082 | -0.0042 | 0.0035 | 0.0092 | 103.525 | ||||||||
| R | R | -0.0028 | 0.0002 | 0.0023 | 0.0028 | 87.996 | ||||||||
| I | I | 0.0090 | -0.0164 | 0.0025 | 0.0187 | 149.444 | ||||||||
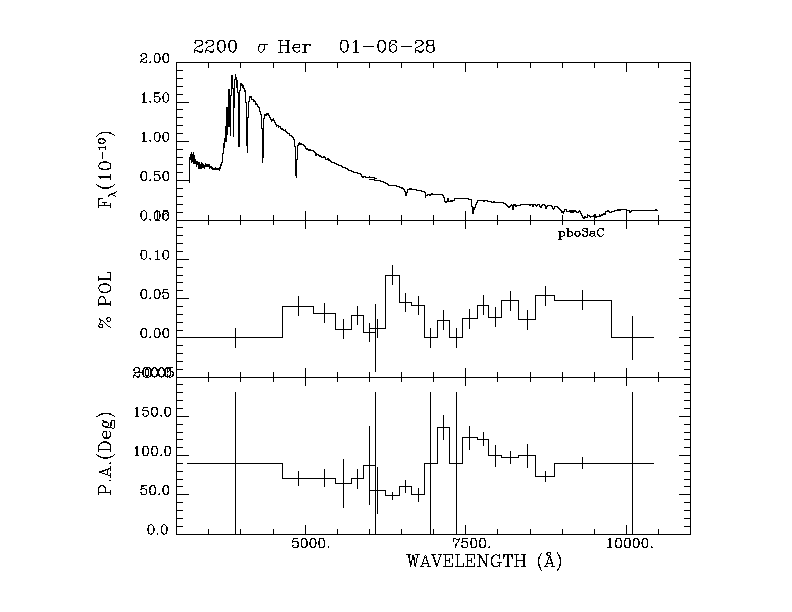
| Sig-Her | 20010628 | 52088.66 | 2048 | 3175. | 6100. | -0.0191 | 0.0135 | 0.0049 | 0.0234 | 72.32 | _ | pbo3aC | _ | Triplot |
| Sig-Her | 20010628 | 52088.62 | 1536 | 6002. | 10426. | -0.0187 | 0.0057 | 0.0032 | 0.0195 | 81.53 | _ | pbo3aC | _ | Triplot |
| UX | UX | 0.1746 | 0.2107 | 0.0294 | 0.2736 | 25.170 | ||||||||
| B | B | -0.0092 | -0.0079 | 0.0062 | 0.0122 | 110.278 | ||||||||
| V | V | -0.0221 | 0.0203 | 0.0036 | 0.0300 | 68.686 | ||||||||
| R | R | -0.0109 | 0.0219 | 0.0021 | 0.0245 | 58.223 | ||||||||
| I | I | -0.0251 | -0.0122 | 0.0022 | 0.0279 | 102.954 | ||||||||
| Sig-Her | 20020707 | 52462.73 | 1920 | 3175. | 6103. | 0.0025 | -0.0031 | 0.0054 | 0.0040 | 154.15 | _ | pbo3aE | _ | Triplot |
| Sig-Her | 20020707 | 52462.70 | 1416 | 6042. | 10434. | -0.0288 | -0.0032 | 0.0036 | 0.0290 | 93.19 | _ | pbo3aE | _ | Triplot |
| UX | UX | 0.0460 | 0.1074 | 0.0331 | 0.1169 | 33.408 | ||||||||
| B | B | 0.0648 | 0.0221 | 0.0070 | 0.0684 | 9.420 | ||||||||
| V | V | -0.0032 | -0.0099 | 0.0038 | 0.0104 | 126.070 | ||||||||
| R | R | -0.0143 | 0.0059 | 0.0024 | 0.0155 | 78.728 | ||||||||
| I | I | -0.0367 | -0.0146 | 0.0024 | 0.0395 | 100.843 | ||||||||
| Sig-Her | 20040604 | 53160.74 | 2048 | 3175. | 6109. | -0.0150 | -0.0119 | 0.0050 | 0.0192 | 109.24 | _ | pbo3aF | _ | Triplot |
| Sig-Her | 20040604 | 53160.71 | 1536 | 6030. | 10426. | -0.0305 | -0.0007 | 0.0033 | 0.0305 | 90.68 | _ | pbo3aF | _ | Triplot |
| UX | UX | 0.0555 | -0.0332 | 0.0243 | 0.0647 | 164.547 | ||||||||
| B | B | -0.0026 | -0.0181 | 0.0062 | 0.0183 | 130.966 | ||||||||
| V | V | -0.0192 | -0.0037 | 0.0036 | 0.0196 | 95.488 | ||||||||
| R | R | -0.0260 | -0.0021 | 0.0023 | 0.0261 | 92.321 | ||||||||
| I | I | -0.0311 | -0.0024 | 0.0023 | 0.0312 | 92.244 |